
MODERN ANALYSIS
Transform disparate data point into a point of view.

In finance, working with sheets of data is part of your everyday life. You think in formulas. You communicate in tables, charts, and variances. You eat columns of data for lunch and the numbers you dream about just make sense. For the rest of the company, it’s a different story.
It's time to bring the business together. Evolve from static disconnected spreadsheets, siloed data, and hard to understand finance metrics to a new way of getting clear on-the-spot answers to pressing business questions in clicks, not tabs.
The benefits

Eliminate manual errors
Data is clean and enriched in seconds. Never worry about data wrangling and copy-paste errors.

Automate repetitive analysis
Access out-of-the-box metrics or create your own with easy to use syntax built to scale for the next question.

Report in real-time
Get insights today, not next month. Share performance updates with internal and external stakeholders in real-time.
analyze
Answer adhoc questions on the fly
Pull up hundreds of SaaS metrics at the click of a button including complex financial ratios. Easily transform them into charts, graphs, or tables that can be viewed from multiple dimensions with attribute filtering.

Combine financial and non-financial metrics
Drill down to explore deeper trends
Out-of-the-box FP&A templates

Topline
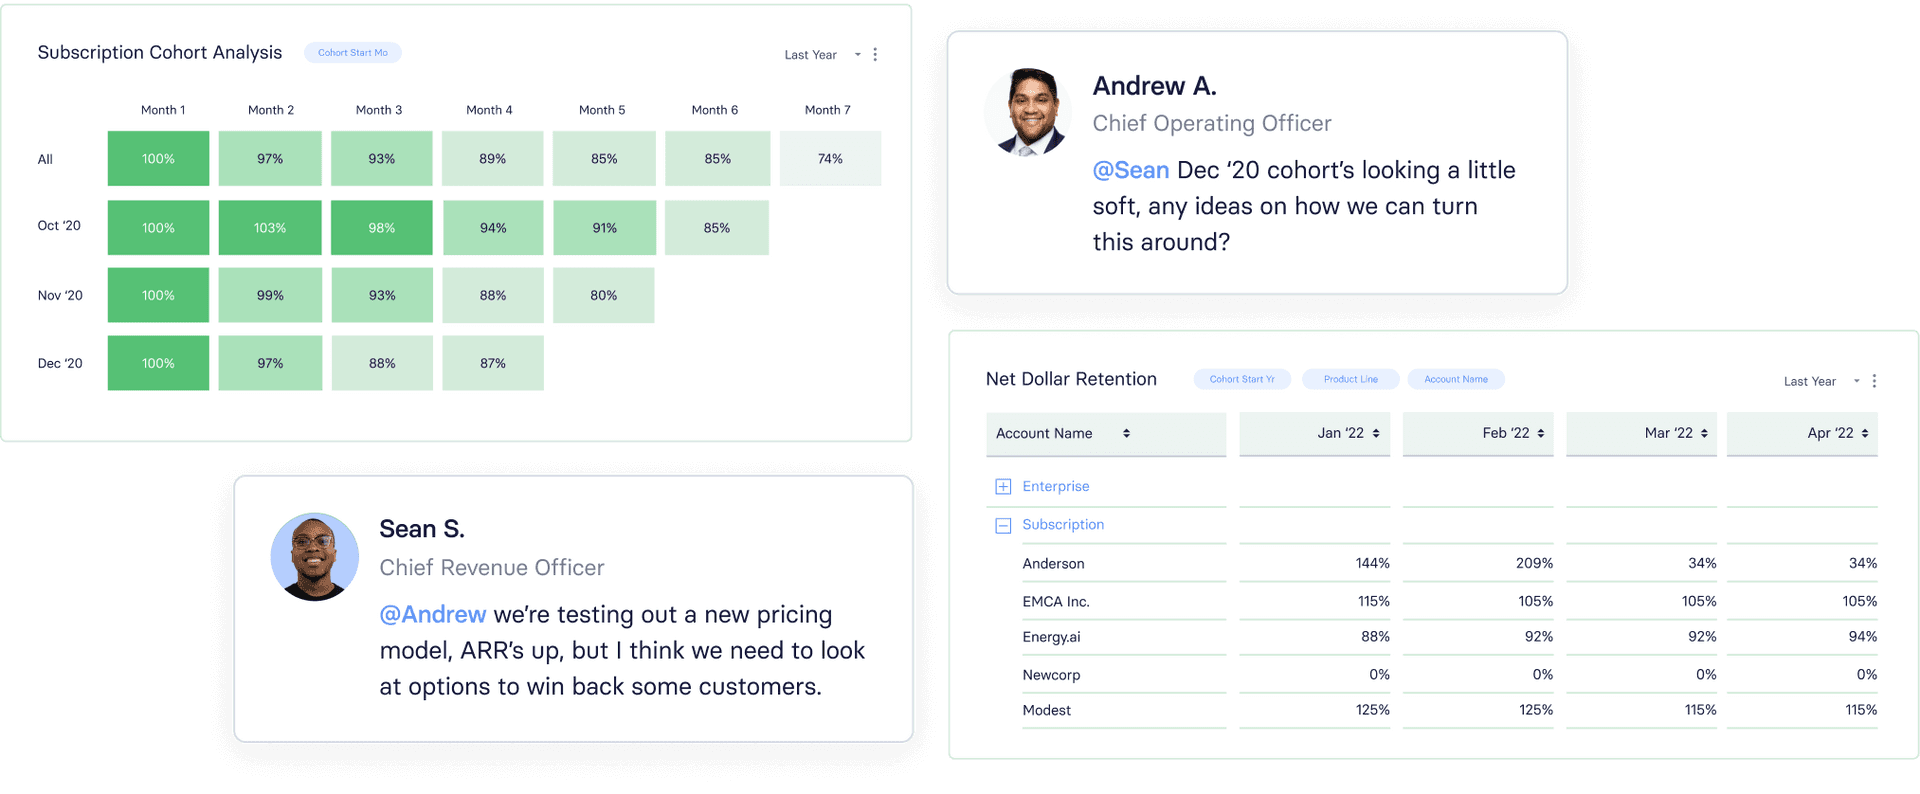
Uncover revenue and customer trends
Go beyond the general ledger. Access a wide range of metrics to uncover a more complete view of key drivers impacting business performance.

Topline
Uncover revenue and customer trends
Go beyond the general ledger. Access a wide range of metrics to uncover a more complete view of key drivers impacting business performance.
ARR/MRR Trends

Sales Performance
Cohorts
Retention Metrics
cash flow
Know where every dollar is going
Managing inflows and outflows of cash effectively is at the core of business survival. Easily understand your cashflow and
expense trends to see how money is being invested down to the department level.

cash flow
Know where every dollar is going
Managing inflows and outflows of cash effectively is at the core of business survival. Easily understand your cashflow and
expense trends to see how money is being invested down to the department level.
Net burn
Cashflow
Runway
track
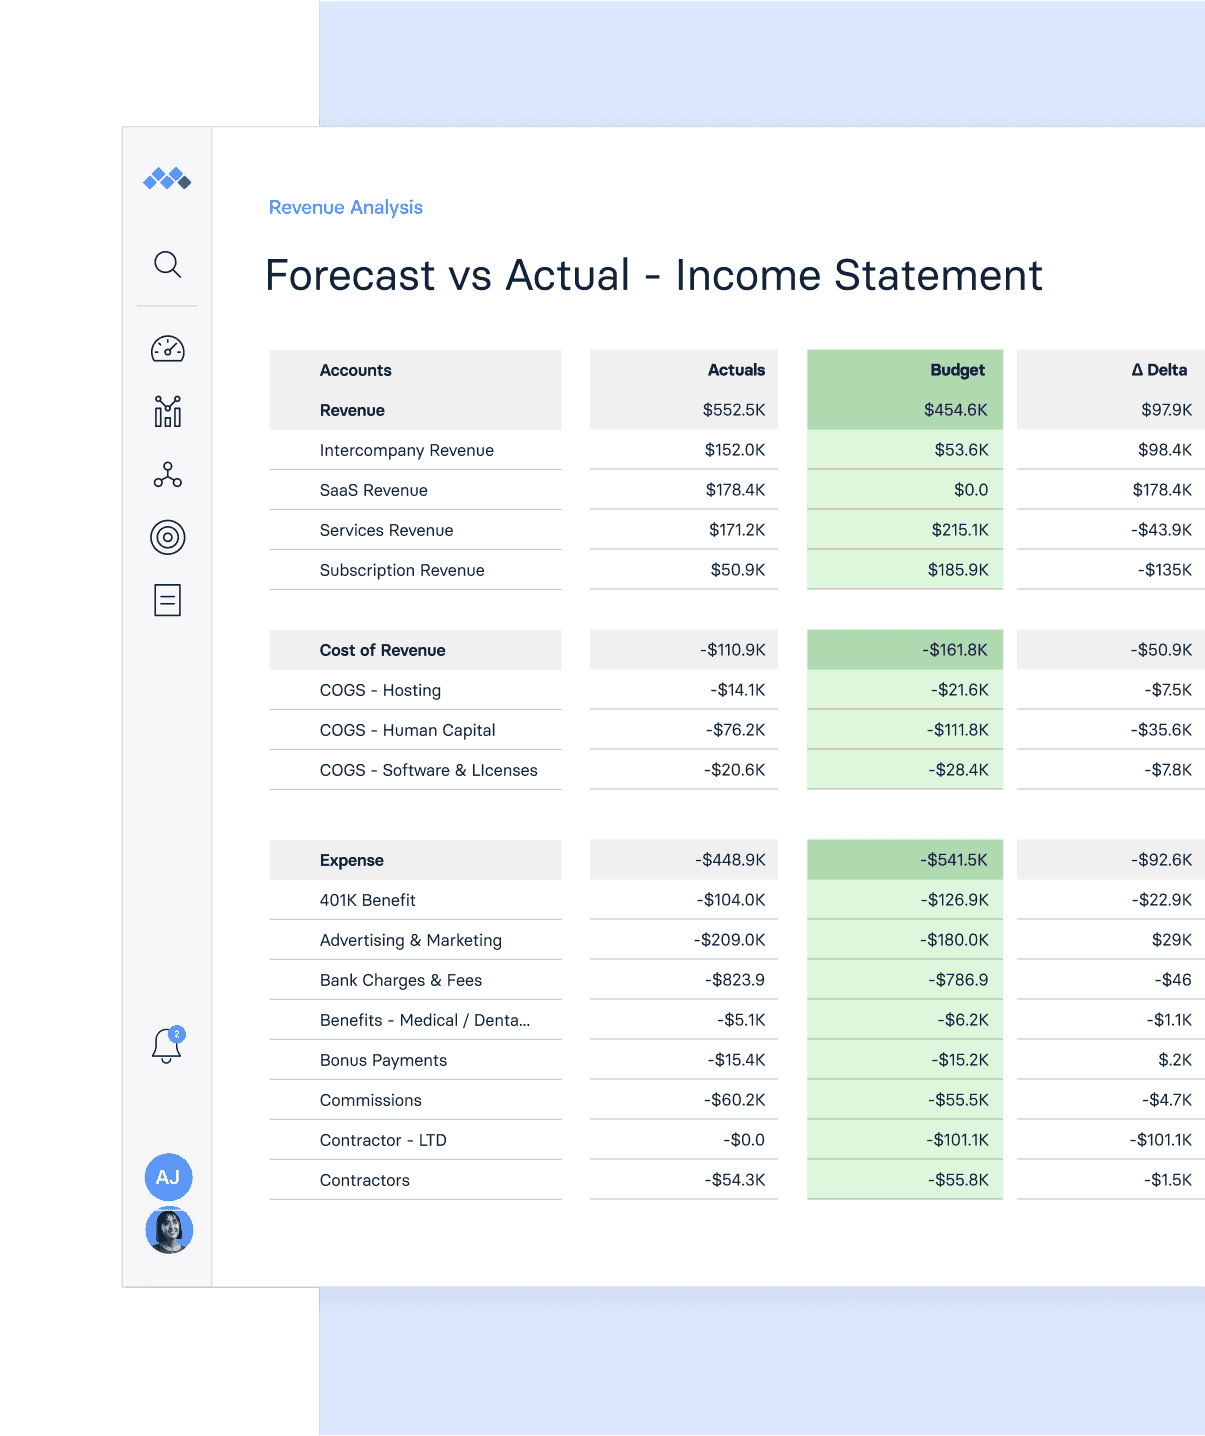
Understand performance variances in real-time
See how your projections hold up over time with real-time budget and forecast vs. actual dashboards. Drill down into the numbers to view root causes so you know when to put the foot on the gas or scale down to more calculated risks.

track
Understand performance variances in real-time
See how your projections hold up over time with real-time budget and forecast vs. actual dashboards. Drill down into the numbers to view root causes so you know when to put the foot on the gas or scale down to more calculated risks.

Budget vs. actuals
Headcount changes

Performance alerts
Mosaic is an amazing strategic finance platform that gives us all our financial insights in one place.
Meagan MirandaFinance Manager at Wellthy
Share
Bring everything together using intuitive flash reports
The Mosaic analysis canvas enables teams to transform individual insights into a meaninful story. Key metrics, goal variances, and bigger business trends can be customized in a matter of minutes.


